Production-ready React js charts in Figma2 min read
Reading Time: 2 minutes
Design with ready-to-use React charts in Figma! 👉 Download the UI kit here👈
Your application needs a dashboard. Congrats! This means you’re growing :).
Whether you call them charts, graphs, or tables, data visualizations are some of the most common components in web applications today. This is why there is a huge variety of well-maintained React libraries that include charts with extended functionalities. And most developers would rather use these libraries than build new charts from scratch.
Bringing open source libraries into your design tool
There’s a huge variety of open source component libraries. They’re well-maintained, and have already been developed and tested. So why torture yourself trying to invent new ones that would take days to build and probably lack some capabilities?
Anima’s answer: reuse, adjust, and improve instead of re-building what already exists! 👇
- Use popular open source libraries with extended functionalities
- Design it to fit your application within Figma
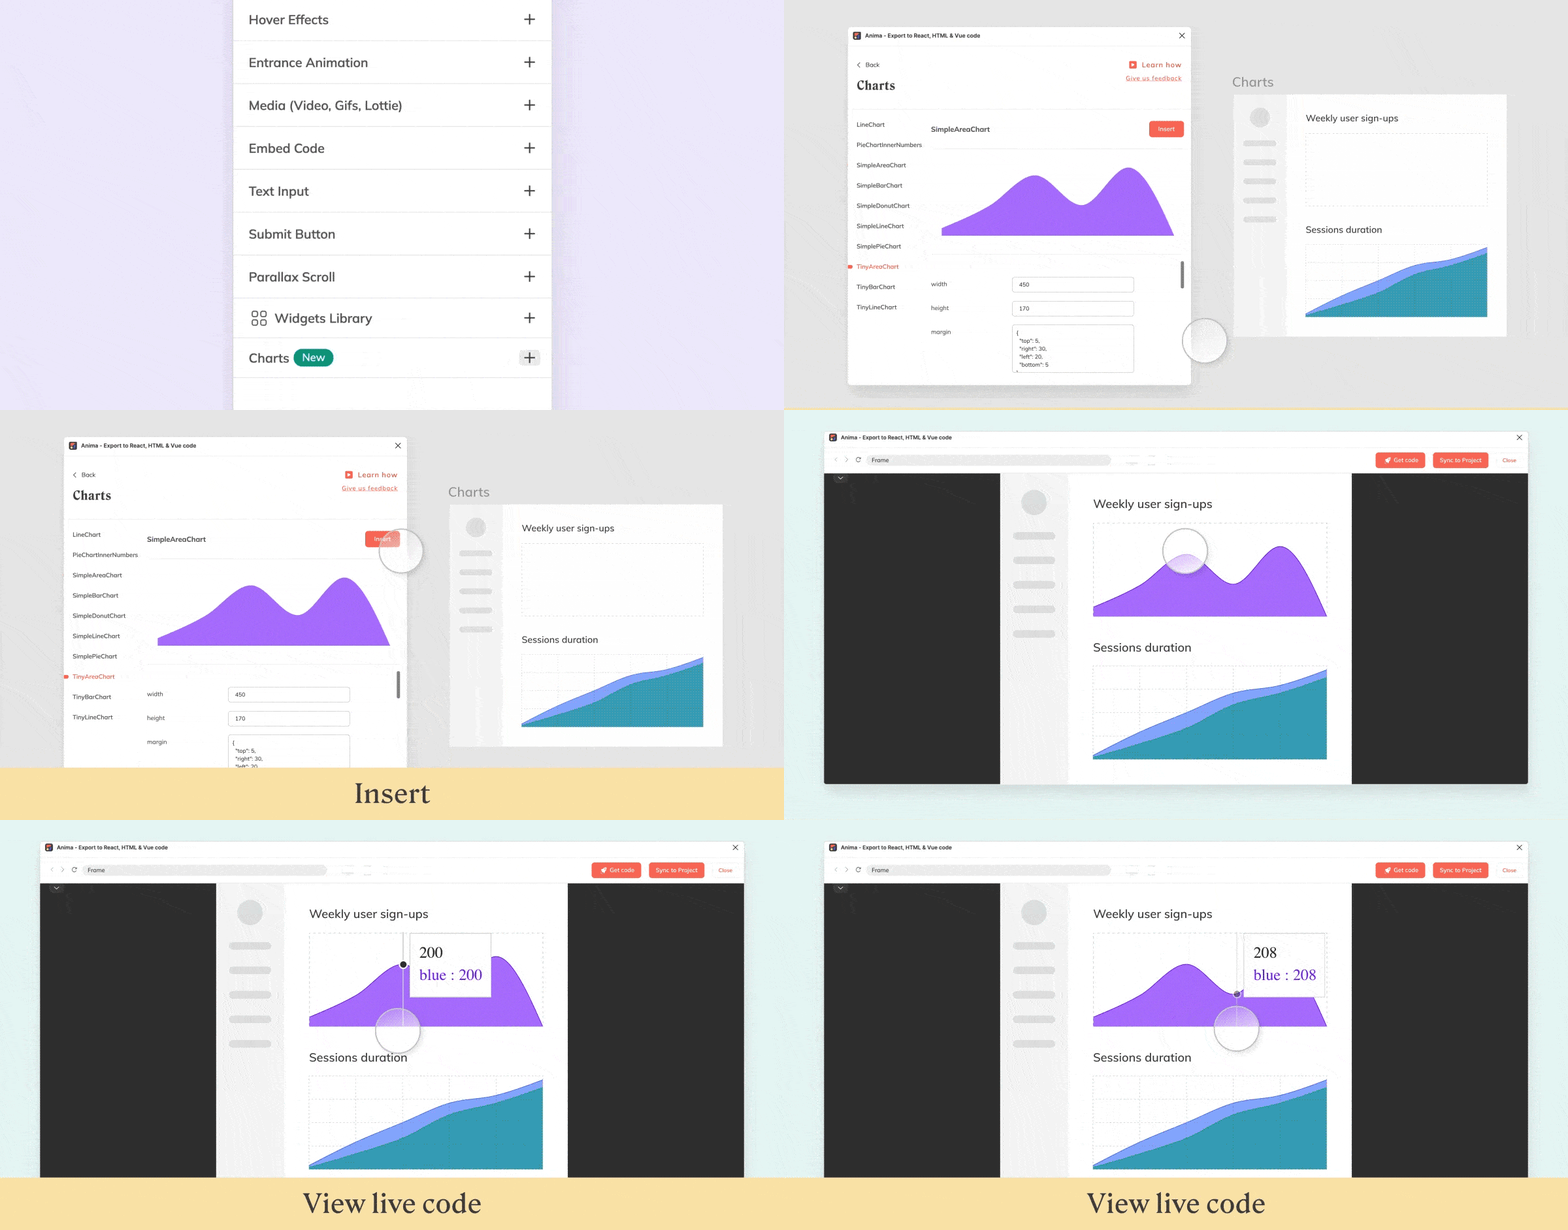
- Export ready-to-use React code and use it in your application
It’s that easy. Hop-on and try it yourself, or start with Anima’s UI kit.
What is this for?
Prototyping with live components
- Build demos in a couple of minutes
- Get a live website with interactive & responsive charts – see here
Getting production-ready chart components from your designs
- Design charts as you want
- Get ready-to-use Recharts** components
Who is this for?
Founders
The (first) charts library we’ve added is Recharts.org, and we use its API to enable customization. You don’t have to be a designer to create beautiful & responsive data visualizations. Just insert these pre-built charts into your design tool, and voila! 🪄
- Create stunning dashboards—no design skills required
- Build demos in a couple of minutes
- Reduce your time-to-market
Designers
How frustrating it is to plan an amazing design and then see it break in real life? Or to hear your developers say a design either can’t be implemented or would take too long to build?
- Design what your users will actually see
- Don’t settle for “close enough”
- Get live prototypes in a single click
Use popular, thoroughly tested components that actually work. Customize and adjust them to fit your needs. Missing something? Ping us!
Developers
Don’t waste time building new charts or tailoring existing ones to match the design. Get ready-to-use Recharts components, already customized by the library’s API.
- Get ready-to-use responsive charts and simply connect them to your data
- Stop getting components that are impossible to implement
__
**We’re starting with Recharts
Recharts is the top used React charts library, with an active developer community and 17.8K stars on GitHub. It has native SVG support, declarative components, and it also boasts ~1M weekly npm downloads!

 Figma
Figma Adobe XD
 Sketch
 Blog
Blog